【3D】地球数据流
条评论示例效果
这是3D可视化教程系列的文章,如果第一次阅读请先阅读《3D可视化教程导读》,这里展示简单的模型拆解效果,可访问a-dismantling 展示网址:
源码及3D项目文件
源码及工程项目都放到github上。
源码:threejs-example。
原理
地球数据流的知识点主要包括球体贴图、经纬度的换算、曲线移动效果、文字面板效果等。
地球的效果本质就是给一个球体的表面贴上一张世界地图,我是参考国外有个网站creating-webgl-earth-with-threejs进行参考制作的,注意地图宽高比要2:1,不然贴上去会变形。球体的半径不要太小,否则在经纬度换算时,JS的精度误差导致位置不太对得上。经纬度的换算成球体上的三维坐标计算方法:1
2
3
4
5
6
7
8
9
10
11// latitude 纬度
// longitude 经度
// 自行网上搜索经纬度来验证
function convertLatLngToSphereCoords (latitude, longitude) {
const phi = (latitude * Math.PI) / 180;
const theta = ((longitude - 180) * Math.PI) / 180;
const x = -(globeRadius + 0.5) * Math.cos(phi) * Math.cos(theta);
const y = (globeRadius + 0.5) * Math.sin(phi);
const z = (globeRadius + 0.5) * Math.cos(phi) * Math.sin(theta);
return new THREE.Vector3(x, y, z);
}
曲线移动效果对应10-曲线移动文章,不再重复。
文字面板效果就是创建个面板,然后创建canvas写入文字作为此面板的贴图。创建canvas写文字时,注意要让文字居中,宽度可读取动态生成,在试验时可以插入到页面来看效果:1
2
3
4
5
6
7
8
9
10
11
12
13
14
15
16
17
18
19
20
21
22
23
24const ctx = document.createElement("canvas").getContext("2d");
ctx.canvas.style.position="absolute";
ctx.canvas.style.top = "10px";
ctx.canvas.style.left = "10px";
ctx.font = "16px";
const measure = ctx.measureText(name);
ctx.canvas.width = measure.width;
ctx.canvas.height = 32;
ctx.fillStyle = "#fff";
ctx.fillText(name,0,16);
// document.body.appendChild(ctx.canvas);
const texture = new THREE.CanvasTexture(ctx.canvas);
const pGeometry = new THREE.PlaneGeometry( measure.width/6, 3);
const pMaterial = new THREE.MeshBasicMaterial( {
map:texture,
transparent: true,
opacity:0.9,
depthTest:false
} );
const plane = new THREE.Mesh( pGeometry, pMaterial );
plane.position.copy(positionVec3);
scene.add( plane );
另外,面板只在看它的正面时才能看到文字,所以要一直对着摄像头:plane.lookAt(camera.position);。
其它
Github有一个效果不错的例子值得参考学习: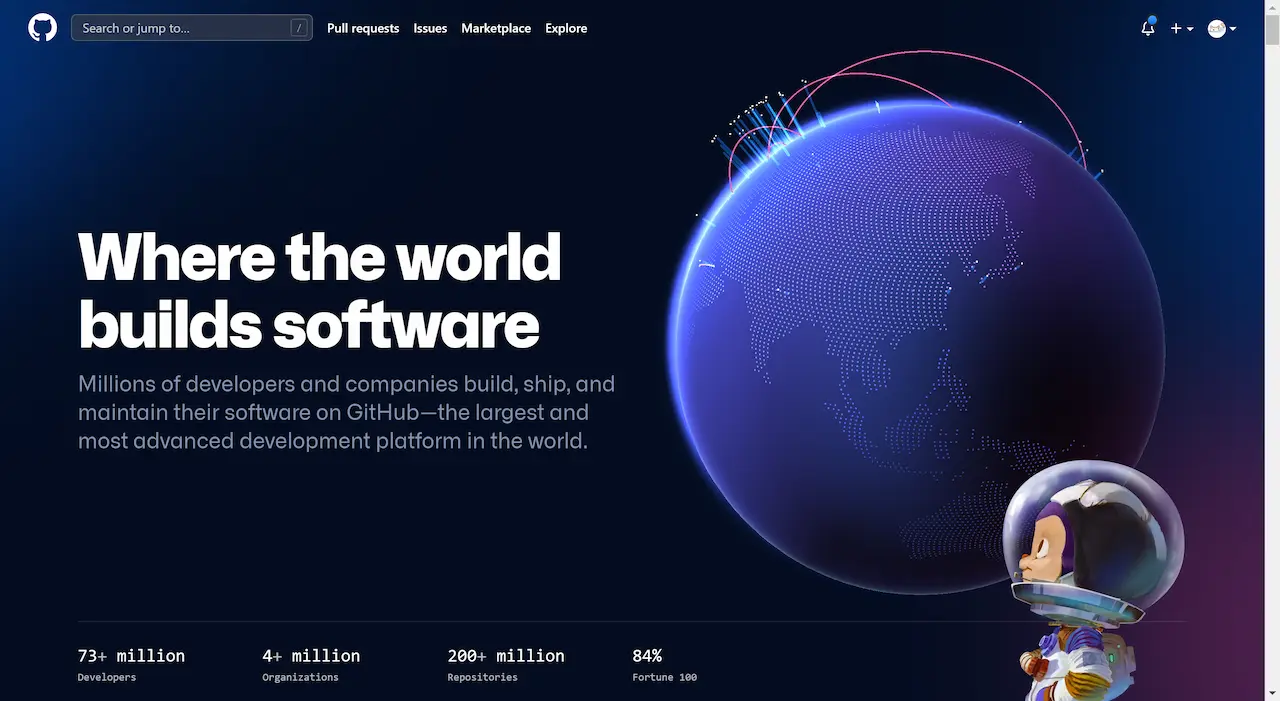
可以注意到它陆地是点阵图效果,而且是圆形轨迹的点阵。另外可以注意到它是左上添加了光亮效果,而右下添加暗效果,达到那种太阳的照射效果。还有个进出时的水波效果,我还没实现,实现的途径之一是在地图canvas上动态画水波纹效果,但这种方法需要考虑变形的问题。